Story highlights
60% -- Americans who supported a handgun ban in 1959
25% -- Americans who supported a handgun ban in 2013
20,947,258 - FBI firearm background checks in 2013
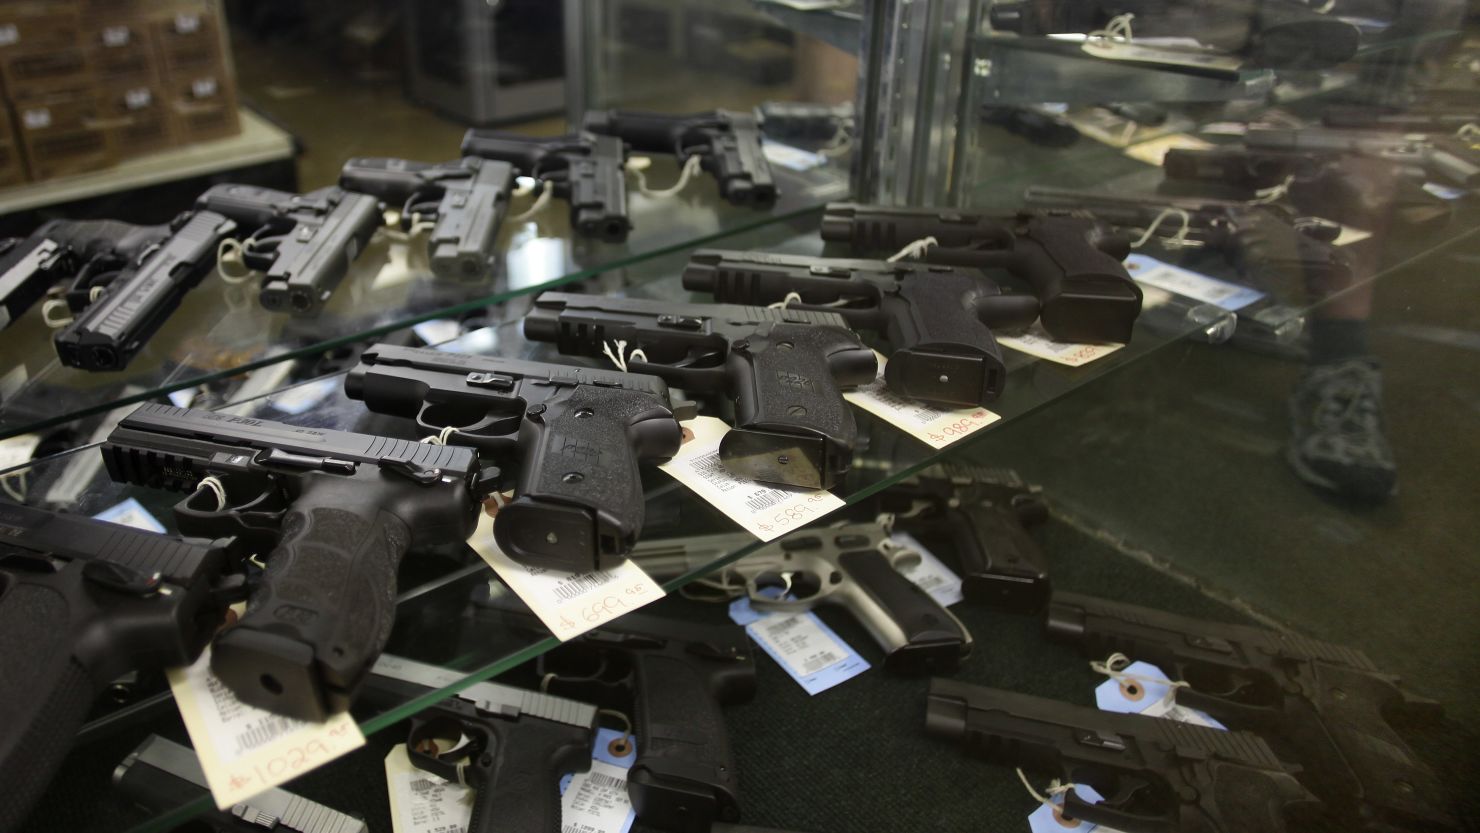
Following the mass shootings in a Colorado movie theater and an elementary school in Connecticut, the debate over gun control has been reignited: How should the country balance its constitutional right to bear arms with access to deadly firepower?
Here’s a look by the numbers on guns in the United States and Americans’ attitudes toward them.
25 - Percent of Americans who favor a handgun ban, a record low, according to a 2013 Gallup poll.
60 - Percent who supported a ban in 1960, the first year Gallup asked this question.
34 - Percent of Americans who own a gun, rifle, or pistol, according to a Pew Research survey.


Analysis: Fewer U.S. gun owners own more guns
27 - Percentage of households in the Northeast with a firearm, the lowest of any region.
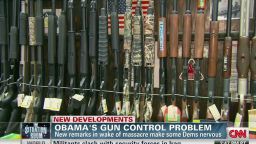
56 - Number of votes the Assault Weapons Ban received in the U.S. in 1994.
19 - Types of military-style weapons affected by the ban.
10 - Years the Assault Weapons Ban was in effect until it expired.
20,947,258 - FBI firearm background checks in 2013.
5,539,538 - Firearms imported into the United States in 2013.
18 - Minimum legal age to possess a handgun or handgun ammunition, with exceptions that relate to employment, farming, hunting, etc.
CNN iReport: 5 things gun owners want you to know
16,238 - Homicides in the U.S. in 2011.
11,068 - Homicides with a firearm in the U.S. in 2011.
153,000 - Brady Act background checks in 2010 that led to the rejection of a potential gun buyer’s application.
47.4 - Percent of applications denied by the FBI for 2010 because of a felony conviction or indictment.